
For more than two years, optimists have been running the show on Wall Street. Since 2022 came to a close, the mature-stock-powered Dow Jones Industrial Average (^DJI -1.69%), broad-based S&P 500 (^GSPC -1.71%), and growth-propelled Nasdaq Composite (^IXIC -2.20%) have respectively risen by 35%, 60%, and 92% as of the closing bell on Feb. 19.
Wall Street’s Bull Market: What’s Driving the Surge?
A mix of catalysts has fueled this impressive rally:
- The artificial intelligence revolution
- A resilient U.S. economy
- Stock-split euphoria
- A significant uptick in share buybacks from S&P 500 companies
- Donald Trump’s return to the White House
While these factors have pushed the market higher, history suggests that trouble may be on the horizon.

Beats Powerbeats Pro 2 Wireless Bluetooth Earbuds – Noise Cancelling, Apple H2 Chip, Heart Rate Monitor, IPX4, Up to 45H Battery & Wireless Charging
Over 150 Years of Valuation History Spells Trouble for Wall Street
Predictive indicators frequently warn of turbulence ahead. In 2023, the first notable decline in U.S. M2 money supply since the Great Depression raised concerns. But nothing sounds the alarm quite like one of Wall Street’s most trusted valuation tools.
When it comes to valuation, most investors think of the price-to-earnings (P/E) ratio—the company’s share price divided by its trailing-12-month earnings per share. While useful, the P/E ratio can be misleading due to market cycles and economic downturns.
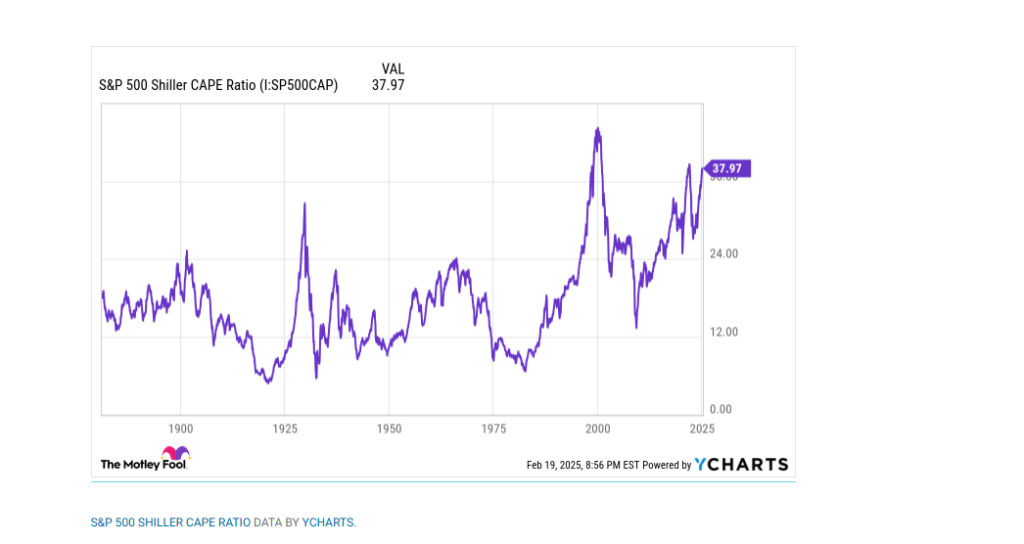
A more reliable measure is the Shiller P/E ratio, also called the cyclically adjusted P/E (CAPE) ratio. Unlike the traditional P/E ratio, the Shiller P/E is based on the average inflation-adjusted earnings from the prior 10 years, smoothing out volatility from short-term economic shocks.
Although the Shiller P/E gained prominence in the late 1990s, its data has been back-tested over 154 years. As of Feb. 19, the S&P 500’s Shiller P/E stood at 38.75—just shy of its highest reading during this bull run (38.89) and more than double its historical average of 17.21 since January 1871.
The current bull market is only the third time in history that the Shiller P/E has exceeded 38:
- December 1999: Peaked at 44.19, just before the dot-com bubble burst, wiping out 49% of the S&P 500’s value and 78% of the Nasdaq Composite.
- January 2022: Crossed 40, marking the start of the most recent bear market.
Since 1871, there have been only six instances when the Shiller P/E stayed above 30 for at least two consecutive months. Each previous occurrence was followed by sharp downturns, with major indices shedding between 20% and 89%.
Warren Buffett’s Favorite Valuation Indicator Flashes Red
The Shiller P/E isn’t the only red flag. A valuation measure that Warren Buffett once called “probably the best single measure of where valuations stand at any given moment” is also flashing warning signs.
Known as the Buffett Indicator, this metric compares the total market capitalization of all U.S. stocks to U.S. GDP. Historically, this ratio has averaged 85% since 1970.
This past week, the Buffett Indicator hit an all-time high of 207.24%—a staggering 144% premium to its 55-year average. Even after adjusting for Q4 GDP data, it remains higher than its previous all-time peak in December.
Historically, extreme readings of the Buffett Indicator have preceded major market downturns:
- 2022: The indicator surpassed 195% right before the bear market.
- COVID-19 Crash: Topped 166% before the market plunged.
While neither the Shiller P/E nor the Buffett Indicator can precisely time market crashes, their track records in predicting downturns remain flawless.
Warren Buffett Indicator soared to an all-time high of 209% 🚨 For context, it peaked at 140% before the Dot Com Bubble Burst pic.twitter.com/bBiqziD0iG
— Barchart (@Barchart) December 9, 2024
Time and Perspective: The Market’s Ultimate Equalizers
For newer investors, talk of potential market declines might sound alarming. However, a long-term perspective tells a different story.
The Power of 20-Year Returns
Crestmont Research has analyzed 106 rolling 20-year periods of S&P 500 total returns (including dividends) dating back to 1900. The results? Every single 20-year period yielded a positive return. Any investor who bought into an S&P 500 index fund and held it for 20 years made money—100% of the time.
It's official. A new bull market is confirmed.
— Bespoke (@bespokeinvest) June 8, 2023
The S&P 500 is now up 20% from its 10/12/22 closing low. The prior bear market saw the index fall 25.4% over 282 days.
Read more at https://t.co/H4p1RcpfIn. pic.twitter.com/tnRz1wdonp
Bull Markets Last Longer Than Bear Markets
A separate analysis by Bespoke Investment Group examined 94 years of market cycles dating back to the Great Depression. Their findings:
- The average bear market lasted 286 days (9.5 months).
- The longest bear market lasted 630 days (mid-1970s).
- The average bull market lasted 1,011 days (nearly three years).
- More than half of bull markets have lasted longer than the longest bear market.
The Bottom Line: Long-Term Investing Wins
No matter how ominous these valuation tools seem, history shows that time and perspective remain undefeated in predicting long-term market growth.
Should You Invest in the S&P 500 Right Now?
Before investing in the S&P 500, consider this:
The Motley Fool Stock Advisor team just revealed their top 10 stock picks, and the S&P 500 didn’t make the cut. These hand-picked stocks have the potential for massive returns.
For example, when Netflix was recommended on Dec. 17, 2004, a $1,000 investment would now be worth $552,526! The Stock Advisor’s total average return stands at 942%, significantly outperforming the S&P 500’s 178% return.
Don’t miss out—check out the latest top 10 stocks today!