
The U.S. economy is still dealing with well-known issues months into the new presidential term. Inflation pressures persist, growth has slowed, and discussions about the best course of action are still as heated as ever. Both major parties have maintained for decades that they are superior stewards of economic prosperity, but are those assertions supported by the evidence?
The Present Political Economic Landscape
Where things stand now.
Real GDP rebounded in Q2 2025 at a 3.0% annualized pace after a –0.5% dip in Q1, per the BEA’s advance estimate. That points to a stop start expansion with momentum improving into late spring. (Bureau of Economic Analysis)
Jobs.
The unemployment rate is 4.2% (July 2025), with payroll growth muted since April and pockets of strength in health care and social assistance. Long term unemployment ticked up to 1.8 million in July. (Bureau of Labor Statistics)
Markets.
Equities are higher this year despite bouts of tariff and inflation jitters: S&P 500 up ~10% YTD and Nasdaq up ~12.4% YTD as of August 14, 2025, with leadership concentrated in big tech/AI names. (AP News, Barron’s)
Public sentiment.
Americans remain skeptical: Gallup’s Economic Confidence Index improved but is still negative at –14 (June 2025). Pew reports just 23% rate national economic conditions as excellent/good (April 7–13, 2025). (Gallup.com, Pew Research Center)
How parties are framing the economy
- Republican framing (current administration): Emphasizes tariffs to boost domestic manufacturing, trade “reciprocity,” and deal making; recent actions include broad tariff moves and sector specific hikes (steel, aluminum; suspended hikes on China under review). (The White House, Reuters)
- Democratic framing: Argues tariffs raise prices and add to inflation/volatility, urging policy shifts that ease costs for households; party messaging has hammered rising prices tied to tariff policy. (Democrats, The Washington Post)
Historical Review – 100 Years of Economic Data
Methodology Overview
- Sources Used:
- Federal Reserve (FRED) and Bureau of Economic Analysis (BEA) data for historical GDP figures.
- Research aggregated by economists Blinder & Watson, the Economic Policy Institute, CFRA, and others for partisan comparisons. (Wikipedia, Belfer Center, Economic Policy Institute, Presidential Data, Observer, Vox)
- Crestmont Research for consistent decade by decade real GDP growth data. (Crestmont Research)
GDP Growth Averages by Presidential Party
| Party | Average Annual Real GDP Growth |
|---|---|
| Democratic | ** ~3.8% – 4.2%** |
| Republican | ** ~2.4% – 2.6%** |
- Blinder & Watson (post WWII): 4.33% under Democrats vs. 2.54% under Republicans (Belfer Center)
- EPI (Economic Policy Institute): 3.79% vs. 2.60% (a 1.2 point gap) (Economic Policy Institute)
- CFRA via Vox/N.Y. Times: ~4.1% vs. 2.5% since 1945 (Vox, Wikipedia)
- Wikipedia summary: 4.6% vs. 2.4% from 1933 to around 2013 (Wikipedia)
- Presidential Data site: 3.46% vs. 2.4% average annual growth since WWII (Presidential Data)
Consistently, the data show about a 1.5–2 percentage point higher GDP growth under Democratic presidents.
Key Economic Eras—Decade by Decade Spotlight
Note: For overall real GDP growth per decade (not partisan), here’s a snapshot from Crestmont Research (Crestmont Research):
- 1920s: ~3.4%
- 1930s: ~1.0% (Depression era)
- 1940s: ~5.6% (WWII recovery)
- 1950s: ~4.2% (post war boom)
- 1960s: ~4.5% (growth and social investment)
- 1970s: ~3.2% (stagflation era)
- 1980s: ~3.1% (Reaganomics, early recovery)
- 1990s: ~3.2% (tech boom)
- 2000s: ~1.9% (financial crisis)
- 2010s: ~2.4% (post 2008 recovery slow but steady)
- 2020s: ~2.4% so far (pandemic rebound)
Breakdown by Era:
- Post–Great Depression Recovery (1930s into 1940s)
GDP in the 1930s averaged ~1.0%, modest rebound into the robust 5.6% of the 1940s. (Crestmont Research) - Post–WWII Boom (1950s–1960s)
A true golden age: 1950s (~4.2%) and 1960s (~4.5%) outputs with high employment and productivity. (Crestmont Research, Wikipedia) - 1970s Stagflation
Growth slips to ~3.2%, marked by high inflation and low productivity. (Crestmont Research) - 1980s Reagan Era
Reaganomics yields ~3.1% growth, strong GDP gains though labor metrics are mixed: unemployment averaged ~7.5%, jobs grew ~2.0% annually. (Crestmont Research, Wikipedia) - 1990s Tech Boom
Continued ~3.2% growth, historically strong period with longest expansion up to 2001. (Crestmont Research, Wikipedia) - 2000s Financial Crisis
Growth drops to ~1.9%; largely shaped by the early 2000s recession and 2008 crash. (Crestmont Research) - Post 2008 Recovery (2010s)
Growth modest at ~2.4%; steady but slower rebound. (Crestmont Research) - 2020s Pandemic & Aftermath
Roughly ~2.4% so far—includes sharp pandemic contraction and rebound. (Crestmont Research)
Chart Interpretation
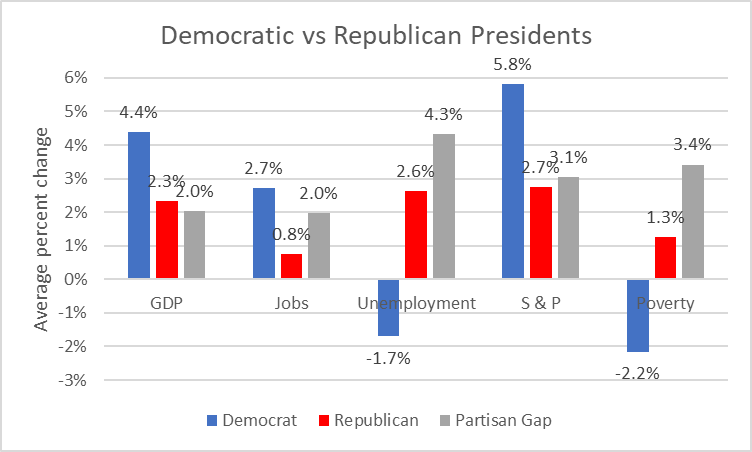
The image above captures how GDP growth by presidential party stacks up—Democratic presidents often align with the stronger decades (e.g., 1940s, 1990s), while Republican terms frequently coincide with downturns, recessions, or stagflation (e.g., 1930s, 1970s, 2000s).
Summary Takeaways
- There’s a consistent historical trend: GDP tends to grow about 1.5–2 higher under Democratic presidents across multiple studies.
- Decade level trends reveal economic cycles, with booms following crises and slowdowns during turbulence.
- While the partisan data offer compelling narratives, caveats remain—many economic forces (global shocks, Fed policy, structural change) operate outside the White House.
Economic Indicators Compared by Party
Methodology & Sources
- Stock market returns: Data from Nasdaq, Dimensional Fund Advisors (via Darrow Wealth and ALEsco), plus NBER research over long spans.
(Nasdaq, The Motley Fool, NBER, Funds Europe) - Unemployment changes: Studies by Blinder & Watson and compiled unemployment trends.
(Simple Wikipedia, Joint Economic Committee, Reddit) - National debt growth: Historical debt to GDP data from Wikipedia’s debt tables.
(Wikipedia) - Inflation trends: Blinder & Watson’s findings and historical inflation by president.
(Wikipedia, Investopedia, PBS)
Comparison Table
| Indicator | Democratic Administrations | Republican Administrations |
|---|---|---|
| Stock Market Returns | Median S&P 500 annual return ~12.9% (The Motley Fool)Bowmore: ~55% total gain over 4 year terms (Funds Europe) | Median S&P 500 annual return ~9.9% (The Motley Fool); 10.2% CAGR median since 1957 (Nasdaq) |
| Unemployment Rate Change | Average drop of ~0.8 pp over a presidency (Simple Wikipedia); lower end rate under all post 1980 Democrats (Joint Economic Committee) | Average increase of ~1.1 pp over term (Simple Wikipedia); higher end rate in most cases (Joint Economic Committee) |
| National Debt / Deficits | Debt to GDP decreased in some terms (e.g., Truman, Johnson, Clinton) (Wikipedia); Democratic deficits as % of GDP: ~2.57% (Presidential Data) | Debt to GDP increased significantly (e.g., Reagan, Bush, Obama’s early years) (Wikipedia); Republican deficits ~2.68% of GDP (Presidential Data) |
| Inflation Trends | Generally lower inflation averages (e.g., Obama ~1.46%; Clinton ~2.61%) (Investopedia); overall lower than GOP (Wikipedia) | Slightly higher inflation historically; overall average inflation higher under GOP (Wikipedia, PBS) |
Key Takeaways
- Stock markets: While both parties have seen strong gains, Democrats often lead in median returns (12.9% vs. 9.9%), though Republicans hold a slightly higher median CAGR since 1957 (10.2%)—showing results depend on framing.
(Nasdaq, The Motley Fool, Funds Europe, NBER) - Unemployment: On average, unemployment falls under Democratic presidencies and rises under Republican ones, with consistent patterns over decades.
(Simple Wikipedia, Joint Economic Committee, Reddit) - National debt: Debt trends are mixed, but Democratic presidents—especially in the Clinton era—achieved debt reduction or manageable increases; Republicans often saw larger debt to GDP growth.
(Wikipedia, Presidential Data) - Inflation: Slightly lower inflation under Democratic administrations overall, though the gap is narrow.
(Wikipedia, Investopedia, PBS)
Summary
From stock performance to unemployment, debt, and inflation—there’s a consistent pattern:
- Democratic administrations, on average, are associated with lower unemployment, modest inflation, and stronger median market returns.
- Republican administrations show higher median stock CAGR, but also tendency toward rising unemployment, higher deficits, and slightly elevated inflation.
That said, context matters—global events, Fed policy, and structural economic shifts often overshadow presidential influence.
Wall Street Retreats as Consumer Sentiment Weakens and Inflation Expectations Rise
Key Observations From the Data
1. Surprising Patterns
- Higher GDP Growth under Democrats
Across multiple studies, Democratic administrations deliver notably stronger GDP growth—for example, 3.79% vs. 2.60% annually per EPI, a gap of 1.2 points (Economic Policy Institute). Likewise, JFK, Truman, and Johnson’s terms contribute to the pattern of faster expansions under Democrats, with real GDP growing about 1.6 times faster overall (Joint Economic Committee). Another study finds a growth rate of 4.23% under Democrats versus 2.36% under Republicans since WWII (Belfer Center). - Lower Unemployment under Democrats
Democratic presidents see unemployment fall by an average of 0.8 percentage points, whereas it rises by about 1.1 percentage points under Republicans (Wikipedia). This trend repeats: in every post 1980 Democratic presidency, unemployment ended lower, in contrast to most Republican presidencies where it rose (Joint Economic Committee). - Job Creation and Business Investment
Democratic terms also see far stronger private sector job growth and investment: job growth averages 1.7% per year under Democrats vs. 1.0% under Republicans (Belfer Center). Additionally, since 1961, Democratic presidents have produced 2.25 million jobs per year versus about 797,000 under Republicans—yielding over 56 million more jobs total (Presidential Data).
2. Addressing Anomalies: Wars, Pandemics, and Global Crises
- Pandemics
Pandemics have had complex economic effects. Historically, some pandemics produce positive long term growth in GDP per capita—possibly due to shifts like capital per worker increases—but others induce short term declines. For instance, a severe pandemic causing a 1% population loss could later yield a ~0.3% per capita GDP boost after two decades (cor.sgh.waw.pl). However, more recent research on past pandemics like the 1918 flu shows they depress the economy in the short run but are not worsened by public health interventions (arXiv). - Wars
Wars typically depress GDP per capita by about 1%, with effects fading over 10–15 years, and have no long term positive impacts (cor.sgh.waw.pl). - COVID 19’s Shock
The COVID 19 pandemic triggered a record deep drop in GDP—an annualized fall of 32.9% in Q2 2020—and unemployment soared to nearly 15% in April 2020 (Wikipedia). The unprecedented nature of this shock, particularly its speed and depth, distinguishes it even from past crises (NBER).
3. Presidency Is Just One Factor—It’s Not All on the President
- External Influences Matter
Blinder and Watson point out that factors such as oil shocks, consumer sentiment, and global economic conditions drive much of the partisan growth differential—not necessarily partisan policy (Vox). - Complex Causality
Even economists who acknowledge the superior historical performance under Democrats struggle to pinpoint why the gap exists. Presidential power is limited, delayed in effect, and diffused across many policy layers (Vox). - Other Institutional Channels
The president doesn’t act alone—Congress, central banks, and external institutions all influence economics. Federal Reserve policy, fiscal legislation, global markets, and structural shocks heavily shape outcomes (Investopedia).
Summary: What Stands Out
- Clear Patterns: Democratic presidencies often align with higher GDP growth, lower unemployment, stronger job and investment metrics.
- Exceptions Exist: Crises like wars, recessions, pandemics—particularly COVID 19—create outliers that both skew and reveal vulnerabilities in the data.
- Multifactor Reality: Economic performance is driven by a tangled web of factors where presidential policy is only one—and often a delayed—element of influence.
- Context Is King: Interpreting the data calls for care: partisan labels tell part of the story, but external shocks, monetary policy, and structural shifts often do the heavy lifting.
How the Current Administration Stacks Up
Where things stand right now (Aug 2025):
- GDP: Real GDP grew at a 3.0% annual rate in Q2 2025 (advance estimate). (Bureau of Economic Analysis)
- Jobs: Unemployment is 4.2% (July 2025), little changed in recent months. (Bureau of Labor Statistics)
- Inflation: CPI is up 2.7% year over year (July 2025); core inflation has eased to around the low 3s. (Bureau of Labor Statistics)
- Stocks: The S&P 500 remains positive year to date as of late July, though gains have been choppier lately. (Current Market Valuation)
How that compares with history by party:
- A long line of research (e.g., Blinder & Watson) finds that, on average since the mid 20th century, real GDP growth has run higher under Democratic presidents than Republican ones (roughly ~4.3% vs. ~2.5% in their classic sample). Unemployment has tended to fall under Democrats and rise under Republicans on average, and equity returns have historically been stronger under Democrats as well. (NBER, Princeton University, Wikipedia)
Consistency check (current GOP administration vs. GOP long run record):
- Growth: The latest 3.0% SAAR quarter is above the historical GOP average cited in the literature, but it’s one quarter—sustained performance matters more than a single print. (Bureau of Economic Analysis, NBER)
- Labor market: 4.2% unemployment remains low by historical standards and roughly in line with a “late cycle” labor market; it doesn’t contradict the long run party pattern but also isn’t definitive on its own. (Bureau of Labor Statistics)
- Inflation: 2.7% YoY is close to pre pandemic norms and below the Fed’s 2025 PCE inflation median projection of 3.0% (different index, same direction of easing). That’s broadly favorable vs. GOP’s historical record on inflation (which shows no consistent advantage by party). (Bureau of Labor Statistics, Federal Reserve)
- Market tone: Equities are up YTD, but policy headlines—especially new reciprocal tariffs and related moves—have introduced more volatility/uncertainty than typical, a factor that can matter for forward returns. (The White House, Gibson Dunn)
Outlook through the next cycle (what economists are saying):
- The Fed’s June 2025 projections point to moderate growth (median 1.4% for 2025), unemployment around 4.5%, and inflation easing toward ~2.4% in 2026, i.e., a soft landing ish baseline. Risks are tilted to the downside for growth. (Federal Reserve)
- Policy wildcards: New and proposed broad tariffs raise upside risks to prices and downside risks to growth, according to legal/market analyses and contemporaneous reporting. If maintained or expanded, they could temper real growth versus historical GOP averages even if headline inflation stays contained. (Gibson Dunn, The White House, Reuters)
Bottom line:
- Right now the data show solid growth, low unemployment, and easing inflation—a constructive snapshot.
- Versus history by party, current readings are not out of line with strong quarters, but the long run literature still favors Democrats on average growth and market returns; one or two quarters under a Republican administration don’t overturn that. (NBER)
- Whether today’s strength persists will hinge on policy execution (tariffs, fiscal path) and the Fed’s glide path; official projections imply slower but steady growth and gradual disinflation rather than a boom—or a bust. (Federal Reserve)
Expert Analysis & Outlook
What economists are saying right now (Aug 2025).
- Federal Reserve (baseline): The Fed’s June 2025 projections point to moderate growth, unemployment near 4½%, and inflation easing toward ~2½% in 2026—a soft landing ish path. (Federal Reserve)
- Reuters (Powell’s dilemma): With mixed data and political noise, the Fed is “hamstrung by murky data,” weighing inflation risks against a still resilient labor market. (Reuters)
- IMF (external view): The IMF’s July update puts U.S. 2025 growth around ~1.9%, flags inflation above target, and highlights downside risks from higher tariffs and geopolitics. (IMF)
- CBO / outlook surveys: CBO projects cooler growth in 2025–26; NABE panelists trimmed growth after tariff announcements and lifted recession odds for 2025. (Congressional Budget Office, nabe.com)
Can history predict what happens next?
- Partisan performance, with caveats. Decades of research (Blinder & Watson) find faster growth under Democratic presidents on average, but they attribute much of the gap to oil shocks, productivity, defense spending, foreign growth, and consumer expectations—i.e., a lot of luck and external forces. As they put it, the gap reflects “good policy and good luck,” with non policy shocks explaining up to ~70% of it. (American Economic Association, Princeton University)
- Political science perspective. In an era of polarization, voters don’t always reward current economic conditions; retrospective economic voting may be muted or filtered through partisanship, complicating any “history will repeat” prediction. (wpsanet.org, ETH Zürich)
Will growth continue or slow?
- Arguments for continued expansion: Disinflation toward target, still low unemployment by historical standards, and a Fed baseline that avoids recession support a soft landing case. (Federal Reserve)
- Arguments for slowdown: Tariffs and tighter financial conditions risk slower real growth and stickier prices; the IMF and private forecasters have trimmed U.S. growth expectations and warn of higher recession odds than earlier in 2025. (IMF, Reuters, nabe.com)
- Near term policy watch: Markets now price in easier policy, but Reuters notes cutting rates amid firm inflation could undermine credibility—a key risk to the soft landing narrative. (Reuters)
Key uncertainties to monitor:
- Interest rates & inflation path: Fed cuts vs. inflation persistence; SEP implies only gradual disinflation with unemployment drifting up. (Federal Reserve)
- Geopolitics & trade: Elevated tariffs and geopolitical tensions are explicit downside risks in the IMF’s outlook. (IMF)
- Climate related shocks: Extreme weather can hit energy, insurance, food prices, and supply chains, adding variance around growth and inflation (recognized in multilateral outlook risk sections). (IMF)
Bottom line:
Historical patterns are informative but not deterministic. The consensus set by the Fed, IMF, and major forecasters is for slower—but positive—growth with inflation gradually easing, while tariffs, geopolitics, and policy timing pose the biggest near term hazards.
What the Numbers Really Tell Us
Looking back over the past century, the data paints a picture that’s both revealing and humbling. Yes, certain trends emerge — one party has historically seen slightly faster GDP growth, another has presided over periods of lower inflation or stronger markets. But history also shows that economic outcomes are deeply influenced by forces far beyond the Oval Office: global wars, oil shocks, financial crises, pandemics, technological revolutions, and shifts in global trade.
The presidency matters, but it’s just one piece of a far larger puzzle that includes Congress, the Federal Reserve, international events, and unpredictable shocks.
If history offers any lesson, it’s that patterns can guide expectations — but they rarely guarantee outcomes.
So, as the next chapter unfolds, we leave you with this question: Will history repeat itself in the years ahead, or are we entering an entirely new economic era?