
President Donald Trump made stock market history as the S&P 500 rose in August, breaking a 75-year streak. Discover what this means for Wall Street, long-term investors, and the future of the U.S. economy.
For more than a century, the stock market has been a stomping ground for wealth creation. Though other asset classes have generated positive nominal returns, stocks have delivered the highest average annual return over ultra-long stretches.
But building wealth on Wall Street isn’t without its hiccups. Stock market corrections, bear markets, and even crashes are the price investors pay for admission to this long-term prosperity machine.”
Earlier this year, “the benchmark S&P 500 (SNPINDEX: ^GSPC) registered its fifth-steepest two-day percentage decline since 1950, along with the iconic Dow Jones Industrial Average (DJINDICES: ^DJI) and the growth-fueled Nasdaq Composite (NASDAQINDEX: ^IXIC) dipping by double-digit percentages. The primary catalyst behind this heightened volatility was President Donald Trump.”
A First in 75 Years
“Trump has also overseen a bit of stock market history by accomplishing something no other president has in 75 years.
According to data collected by Carson Group’s Chief Market Strategist, Ryan Detrick, all six second-term presidents since 1950 endured an S&P 500 decline in August in their post-election year. But with the S&P 500 climbing by 1.9% in August, Trump broke this streak.”
Investors have also been buoyed by other factors. “The euphoria surrounding artificial intelligence (AI) has helped lift the broader market. By one estimate, AI could add $15.7 trillion to global gross domestic product come 2030, which makes it the most game-changing technological innovation since the proliferation of the internet in the mid-1990s.”
Also Read: Hidden Risk in AI Investments Wall Street Won’t Admit
Headwinds Still Loom
“While optimists have undoubtedly enjoyed the strength Wall Street has exhibited over the last five months, it’s a bit premature to go uncorking the champagne bottles. Even though some clouds have cleared, two monumental headwinds stand directly in the path of this bull market.”
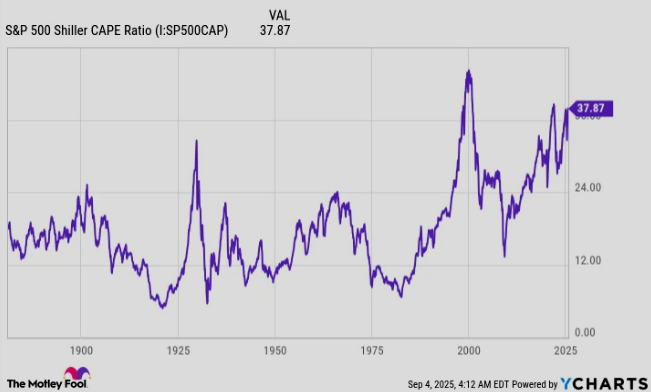
First is valuation. “The best apples-to-apples valuation measure is the S&P 500’s Shiller price-to-earnings (P/E) ratio, which is also known as the cyclically adjusted P/E Ratio (CAPE ratio). When back-tested over 154 years, the Shiller P/E has averaged a multiple of 17.28. Recently, it surpassed 39, marking the third-priciest continuous bull market in history.”
Second is trade policy. “We don’t know the full effect that Donald Trump’s tariff policy is going to have on the U.S. economy. A study published by four New York Federal Reserve economists via Liberty Street Economics in December 2024 pointed to Trump’s China tariffs in 2018-2019 as a warning of what may come. Input tariffs can make domestic production pricier and increase inflation.”
Stocks have never been higher in August under a second term president in a post-election year.
— Ryan Detrick, CMT (@RyanDetrick) August 1, 2025
6 for 6 lower. pic.twitter.com/Ej4CFwftNe
Long-Term Trends Favor Investors
“Uncertainty and volatility are unavoidable aspects of putting your money to work on Wall Street. But even though there’s no quick fix to Trump’s tariff uncertainty or an undeniably expensive stock market, historical precedent clearly favors investors with a long-term mindset.”
Crestmont Research data shows that “all 106 rolling 20-year periods yielded positive annualized returns. Regardless of whether you held through a recession, depression, war, tariffs, stagflation, hyperinflation, a pandemic, or whatever other scenario you can think of, the benchmark S&P 500 was always higher 20 years later.”
Similarly, Bespoke Investment Group noted that “the average S&P 500 bear market lasted 286 calendar days, or approximately 9.5 months. But when the pendulum swung in the other direction, it led to bull markets lasting about 3.5 times as long (1,011 calendar days) over this nearly 94-year stretch.”
It's official. A new bull market is confirmed.
— Bespoke (@bespokeinvest) June 8, 2023
The S&P 500 is now up 20% from its 10/12/22 closing low. The prior bear market saw the index fall 25.4% over 282 days.
Read more at https://t.co/H4p1RcpfIn. pic.twitter.com/tnRz1wdonp
Should You Buy the S&P 500 Now?
“Before you buy stock in S&P 500 Index, consider this: The Motley Fool Stock Advisor analyst team just identified what they believe are the 10 best stocks for investors to buy now… and S&P 500 Index wasn’t one of them.”
“When Netflix made this list on December 17, 2004… if you invested $1,000 at the time of our recommendation, you’d have $670,781! Or when Nvidia made this list on April 15, 2005… if you invested $1,000 at the time of our recommendation, you’d have $1,023,752!