
For the better part of the last two and a half years, “the bulls have been in firm control on Wall Street.” The Dow Jones Industrial Average, the benchmark S&P 500, and the growth-oriented Nasdaq Composite “all achieved numerous record-closing highs during the current bull market rally.”
The driving forces behind this rally have been abundant: “stock-split euphoria, the artificial intelligence (AI) revolution, President Donald Trump’s November victory, and the resilience of the U.S. economy.” However, “the foundation of the U.S. economy may not be as strong as advertised.”
This Recession-Forecasting Tool Was Last Wrong in 1966
“At any given moment, there’s bound to be one or more data points, events, or correlative statistics that spell trouble for the U.S. economy and/or stock market.” One of the most concerning indicators right now is the “Federal Reserve Bank of New York’s recession probability tool.”
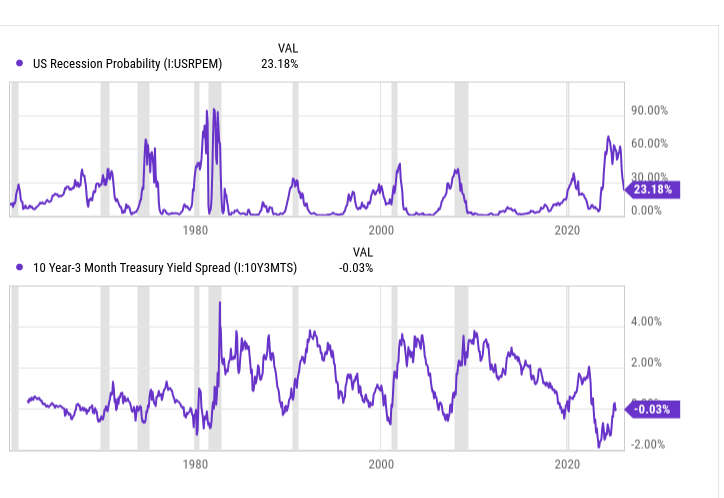
“The New York Fed’s recession-forecasting tool takes into account the difference in yield (known as spread) between the 10-year Treasury bond and three-month Treasury bill to decipher how likely it is that the U.S. economy will fall into a recession over the next 12 months.”
“Typically, the Treasury yield curve slopes up and to the right. This is to say, bonds set to mature in 10, 20, or 30 years are going to bear higher yields than Treasury bills maturing in a year or less.”
But when “the Treasury yield curve inverts,” meaning “the yield on short-term T-bills is higher than for long-term bonds,” it signals concern about the U.S. economy. “

Although not every yield-curve inversion has been followed by a recession, it’s worth pointing out that every recession since World War II has been preceded by a yield-curve inversion.”
“As you’ll note from the chart, one of the steepest (and lengthiest) inversions of the 10-year/three-month yield curve in history led to a recession probability that peaked at north of 70% in 2023.
Since October 1966, there hasn’t been a single instance where the probability of a U.S. recession has surpassed 32% and an official downturn failed to materialize.”
“Perhaps it’s no coincidence that the Federal Reserve Bank of Atlanta’s March 6 GDPNow forecast called for a 2.4% contraction in U.S. gross domestic product (GDP) for the first quarter.” If realized, this “would mark the biggest decline since the Great Recession in 2009.”
Economic Cycles Aren’t Linear, and That’s Music to the Ears of Investors
“Based solely on historic precedent, the U.S. economy and stock market appear to be headed for a challenging couple of quarters.” But “that’s the great thing about history — there are two sides to every coin.”
“Recessions are a normal part of the economic cycle.” However, “the average downturn over the last 80 years has lasted roughly 10 months.” In contrast, “the average economic expansion has endured for around five years.”
It's official. A new bull market is confirmed.
— Bespoke (@bespokeinvest) June 8, 2023
The S&P 500 is now up 20% from its 10/12/22 closing low. The prior bear market saw the index fall 25.4% over 282 days.
Read more at https://t.co/H4p1RcpfIn. pic.twitter.com/tnRz1wdonp
“On one hand, the average bear market resolved in 286 calendar days, or roughly 9.5 months.” But “on the other, the average S&P 500 bull market lasted for 1,011 calendar days over a 94-year period.”
While recessions and downturns can be challenging, “the closest thing you’ll get to a guarantee on Wall Street is that the Dow Jones Industrial Average, S&P 500, and Nasdaq Composite will increase in value over long periods.”
That “should be music to the ears of long-term investors, even if a possible recession is around the corner.