
Recession Fear
Wall Street hasn’t been hurting for catalysts of late. Following a nearly two-and-a-half-year climb in the Dow Jones Industrial Average, S&P 500, and Nasdaq Composite — spurred by the rise of artificial intelligence (AI) — investors have been hypnotized in 2025 by President Donald Trump’s ever-changing tariff policies, wild swings in Treasury bond yields, and the return of stock-split euphoria.
Also Read: Wall Street Eyes Trump’s Next Big Move as Tariff Worries Ease
But it’s fair to question whether Wall Street and the investing community are missing the bigger picture: The U.S. economy.
The Recession Predictor With a Near-Perfect Track Record
According to one recession forecasting tool — which hasn’t been wrong in 59 years and has only been incorrect once when back-tested to 1959 — things may not be as rosy for the U.S. economy and stock market as they appear on the surface.
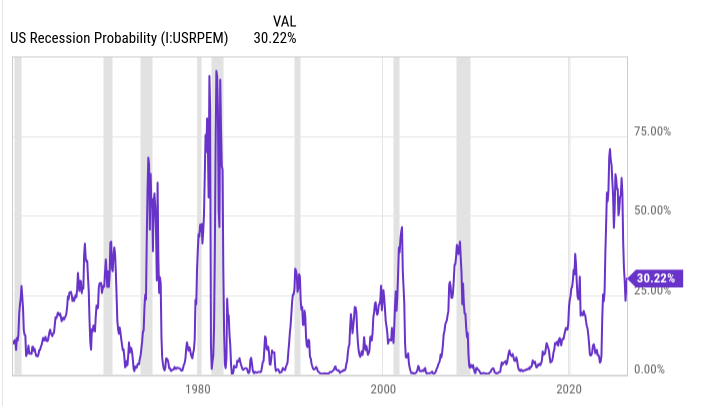
Perhaps Wall Street’s biggest concern at the moment has less to do with Trump’s tariff policies, and everything to do with what the Federal Reserve Bank of New York’s recession probability tool says comes next.
This predictive model analyzes the spread between the 10-year Treasury bond and three-month Treasury bill to estimate the likelihood of a U.S. recession over the following 12 months.
“In a healthy economy, the Treasury yield curve slopes up and to the right… When the yield curve inverts is where trouble starts brewing.”
The Warning from the Yield Curve

The only false positive for the New York Fed’s recession probability tool occurred in 1966. While the May 2025 update shows a 30.45% chance of a recession by April 2026 — down from over 70% in 2023 — “every probability reading above 32% since 1966 has eventually been followed by a U.S. recession.”
But it’s not just about the percentage.
“More often than not, previous recessions didn’t materialize until the yield curve un-inverted and began moving sharply higher.”
Coming off the “steepest inversion of the 10-year/three-month yield curve in four decades,” this un-inversion process is another red flag.
GDP Contraction and Market History Line Up
The initial reading of first-quarter U.S. GDP showed a 0.3% contraction. While better than the Federal Reserve Bank of Atlanta’s GDPNow model had forecast, it still aligns with the New York Fed’s recession indicator potentially being right.
“Around two-thirds of the S&P 500’s peak-to-trough drawdowns between 1927 and March 2023 occurred during, not before, U.S. recessions.” — Bank of America Global Research
Why Not to Panic — The Cyclical Nature of the Economy
Seeing a highly successful predictive indicator forecast a recession may not be what you, as an investor and/or working American, want to hear. But the economy doesn’t move in straight lines — and that’s a good thing.
“Regardless of fiscal and monetary policy, recessions are normal, healthy, and inevitable aspects of the economic cycle.”
Since World War II, the U.S. has experienced 12 recessions, with an average length of just 10 months. None have lasted more than 18 months. By contrast, periods of economic growth average around five years.
Bear vs. Bull Markets: A Tale of Two Lengths
According to Bespoke Investment Group’s 2023 data set:
- The average bear market lasted 286 calendar days (around 9.5 months).
- The longest bear market lasted 630 days during the 1970s oil embargo.
- The average bull market? 1,011 calendar days.
“More than half of all bull markets since September 1929 (14 out of 27) would have lasted longer than the lengthiest bear market.”
Final Takeaway: Don’t Obsess Over the Downturn
“It simply doesn’t make much sense for investors to become too preoccupied with short-lived downturns when historical data conclusively shows that the U.S. economy and stock market spend a disproportionate amount of their time in the proverbial sun.”